Remark is an industry-specific digital integrator. Since 2007 we have been helping companies to be as efficient as possible in the digital environment by automating the processes of marketing, sales and internal interaction between employees. Our main expertise is in real estate, but years of experience and competencies allow us to work with companies in all industries.
Email us
Call us
Data Connector
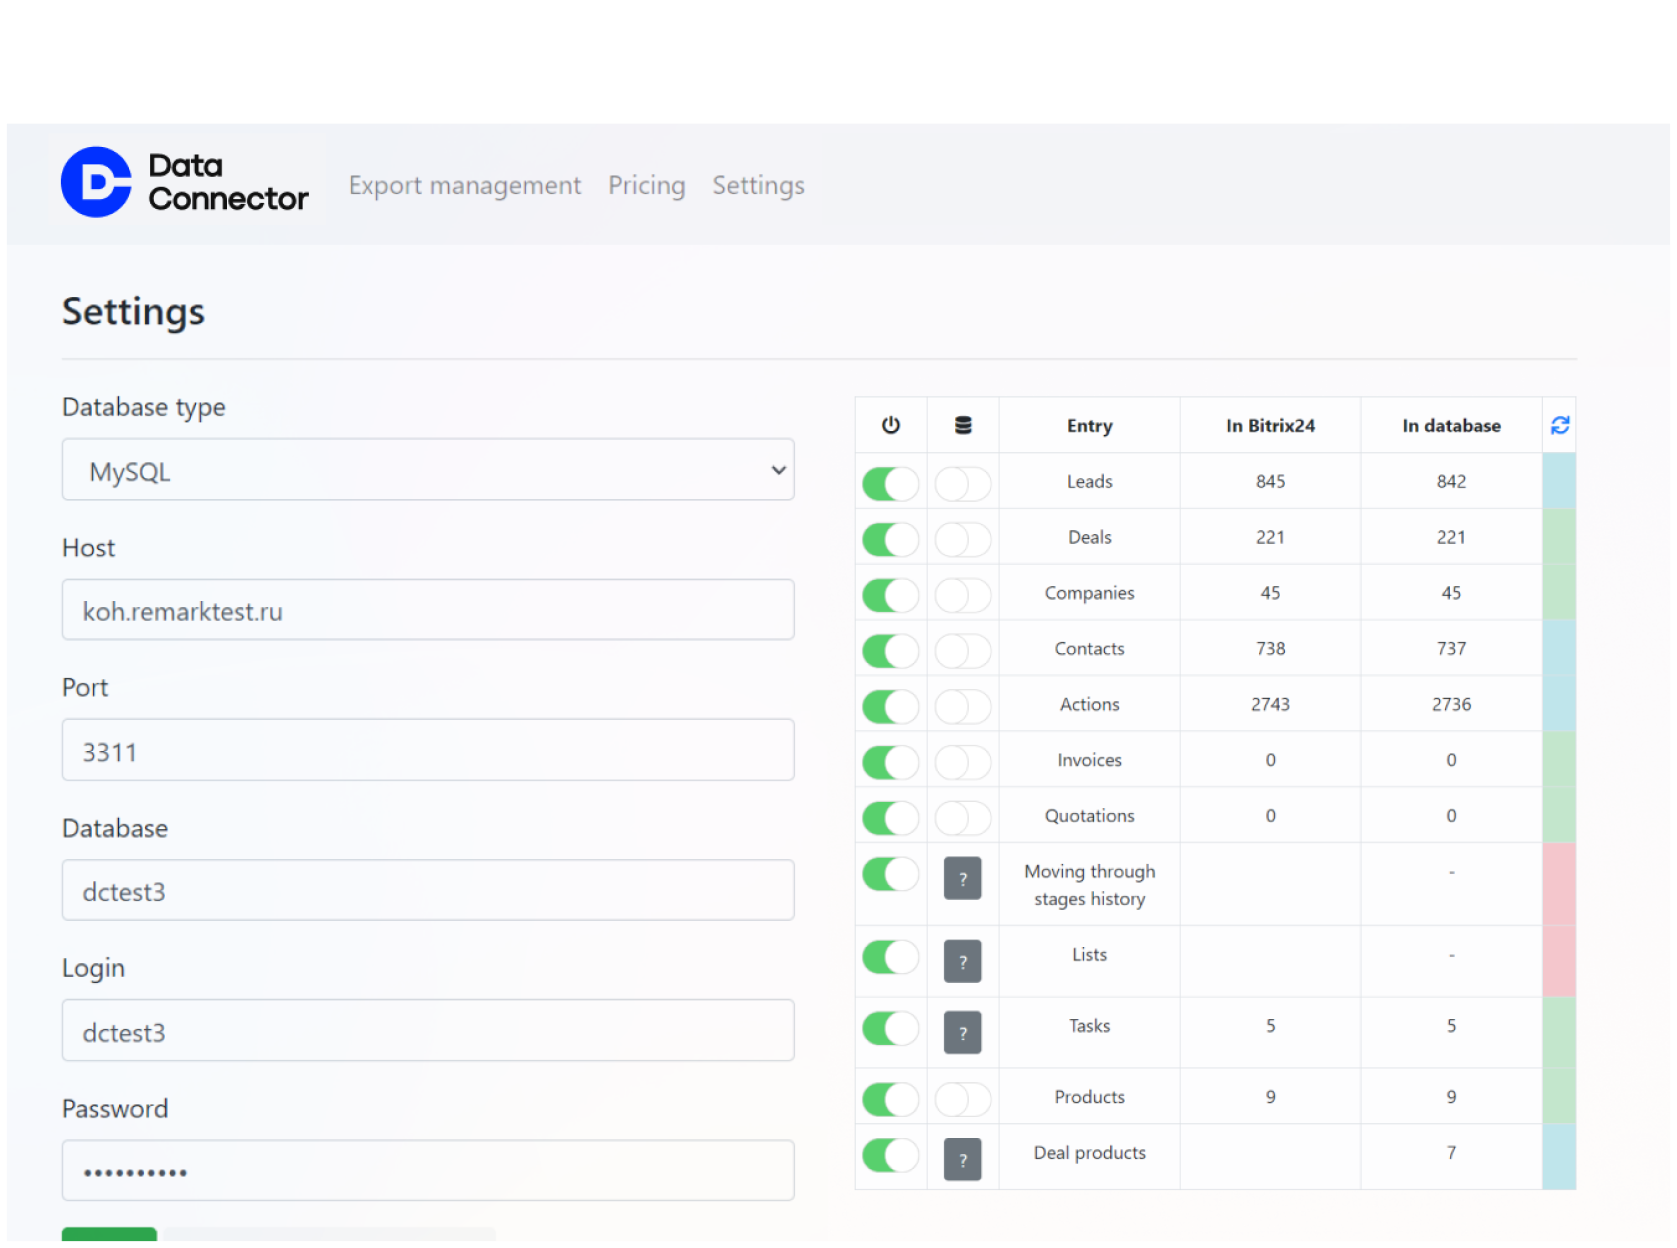
The Data Connector application allows you to export data from Bitrix24 to an external MySQL database and keep it up to date in real time. A standard connector is linked to the created database, and the BI system receives the necessary data through it.


For what?
Working with Bitrix24 we faced with slow data uploading to the database from Bitrix24 due to technical limitations of the REST API. Each time it significantly increased the time of data extraction and made it difficult to analyze statistics.
If you exceed the limit 50 times, access to the REST API is blocked temporarily, the application will not be able to access the data.

Getting access
Bitrix24 REST API
Limit 2 requests\sec
Leads, deals, contacts, etc.
1 query retrieves no more than 50 entity elements. But it is possible to execute 1 package query that contains 50 regular queries, so we can get 50*50=2500 elements of the entity.
Example
We want to export 200,000 transactions from the CRM and conduct analysis. We need to run 80 package queries to do this.
1
=
20
query
seconds
20
x
80
seconds
queries
≈
27
minutes
This is only to get the data, and they still need to be processed and generate a report for analysis. In this case, we will not be able to use the real-time reporting, because the total time of the report construction can exceed 30 minutes. Obviously, this pace of work is unacceptable for comfortable use of the report.
How we bypassed the restrictions
To solve this problem, we have created a Data Connector application. It allows you to export data from Bitrix24 to an external MySQL database and update it in real time. A standard connector is linked to the created database, and the BI system collects the necessary data through it.

Example: The manager created a contact in Bitrix24. Bitrix24 will generate an event and the Data Connector will process it and update the data in the MySQL database
Data Connector usage example
The report helps to monitor the key performance indicators of the real estate developer’s sales department on a daily basis, notice deviations or changes, and correctly interpret them.
A separate database, created using the Data Connector, is used as a data repository. It contains a list of leads and key characteristics, which are updated automatically, in real time.
In Data Studio, this database is connected as a source, and the Blended Data tool is used to display several indicators on the same chart (new, processed, low-quality).
With the data correctly prepared and loaded into Data Studio, it’s pretty easy to figure out the basic visualization tools and prepare your first report.

Data backup
Data can be exported to external databases manually and backed up in case the main device is lost or damaged.

How to install the app?
Data Connector takes the load of data processing, so you don’t have to worry about some data being lost or not exported. The Connector creates an up-to-date copy of Bitrix24 data and allows you to work with it without restrictions at any time. We’ve created a universal data repository from CRM, which can be used to integrate with third-party systems.


